RiverAnalysis
A page hosting my “hobby work” for local river analysis
Project One: Using USGS REST and Synoptic API services to collect, organize, and relate downstream response to upstream impacts.
See YouTube Video I made requesting data from USGS REST API
- This is based on basic hydrology where: In == Out.
- The purpose is to understand downstream response to precipitation. This will aid in understanding timelag for the downstream gauge to “feel” rainfall.
Simply put… when can I expect the best river response for the surf wave at my local whitewater park?
Lets start by looking at the water cycle.
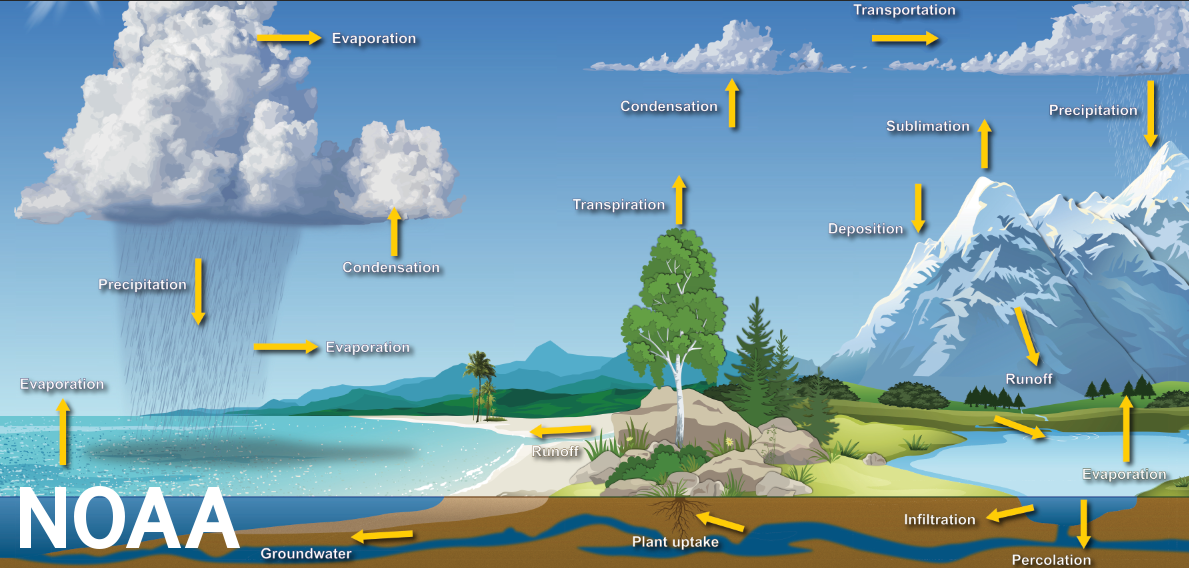
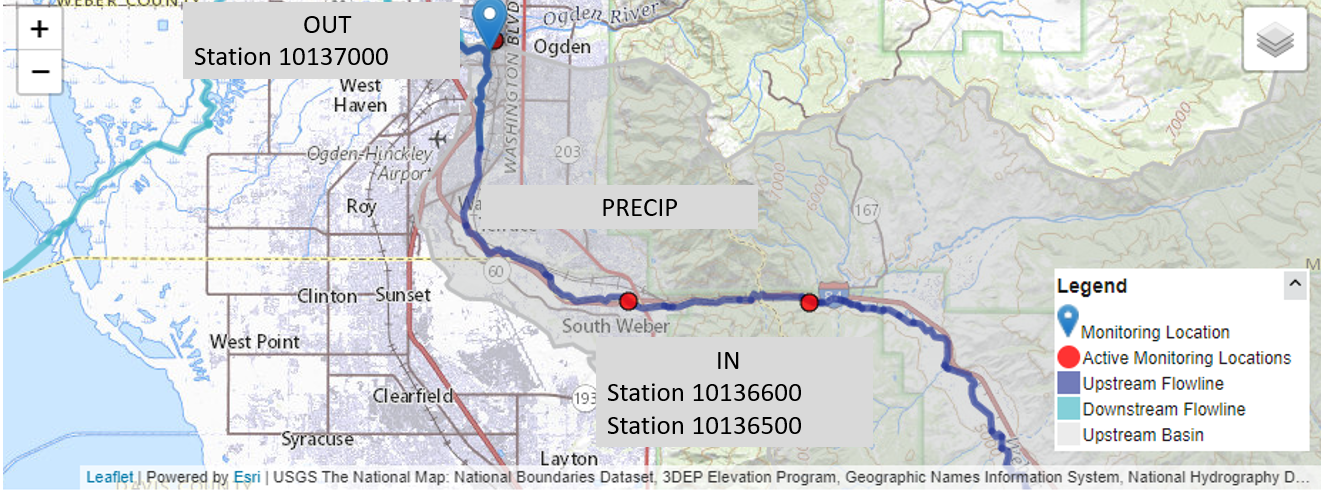
But I only care about precipitation, so we can essentially ignore everything and only focus on that portion of the water life cycle. Where OUT is the CFS measured at station 10137000, at the white water park And IN is the combined runoff/addition from the upstream portions of this problem Ogden park is Station 10137000
Simple Equation 1, Out = In :
- Ogden Park = (Station 1) + (Station 2) + (Precip)
Lets find data!
Well, we know that we need precipitation measurements, and river data. We also want to use python and requests to perform API calls to save data locally.
Example pulling metadata info for stations in the area using Synoptic API
#def mesoNetInfo():
def metaData_info():
    url = "https://api.synopticdata.com/v2/stations/metadata?&token=%s&network=4" % ( myToken() )
    print("Now grabbing MetaData information from UDOT RWIS Network" , url)
    r = requests.get(url)
    if r.status_code != 200:
        print("response failed... " %s (r.status_code) )

    metaData_dictionary = r.json()

    #save rwis json files
    with open('%s/%s.txt' %(data_dir, "rwis_info"), 'w') as outFile:
        json.dump(metaData_dictionary, outFile)
Example for pulling USGS River data with Python requests and saving dictionary return as txt file.
def pullData(site,year,fileName): #Will pull stream info from input of state ex: ut/UT or az AZ NY MT
"""
Variables and what not on USGS API...
Site Type == &siteType=ST where ST == streams
Site Status == &siteStatus={all | active | inactive}
format == &format=json
site or sites, can pass 100 stations
site == &site=0101012013
sites == &sites=01202101,012021001,0102012012 Can pass 100
start and end times.... &startDT=2010-11-22&endDT=2010-11-22 // Full day, from 00:00 to 23:59
lets input a year into the funciton to grab data from that year, to build informaiton....
year can be an integer, float, or strong
"""
url = "http://waterservices.usgs.gov/nwis/iv/?¶meterCd=00060&site=%s&startDT=%s-01-01&endDT=%s-01-02&format=json" % (site, year, year)
#lets grab data...
print("Pulling data from station: %s" %(site))
r = requests.get(url)
if r.status_code != 200:
print("API Request failed, status code: %s" % (r.status_code))
else:
print("Status code 200...")
data = r.json()
print("Now saving json dictionary as file:%s/%s.txt " % (main, fileName))
with open("%s/%s.txt" % (main, fileName), "w+" ) as outFile:
json.dump(data, outFile)
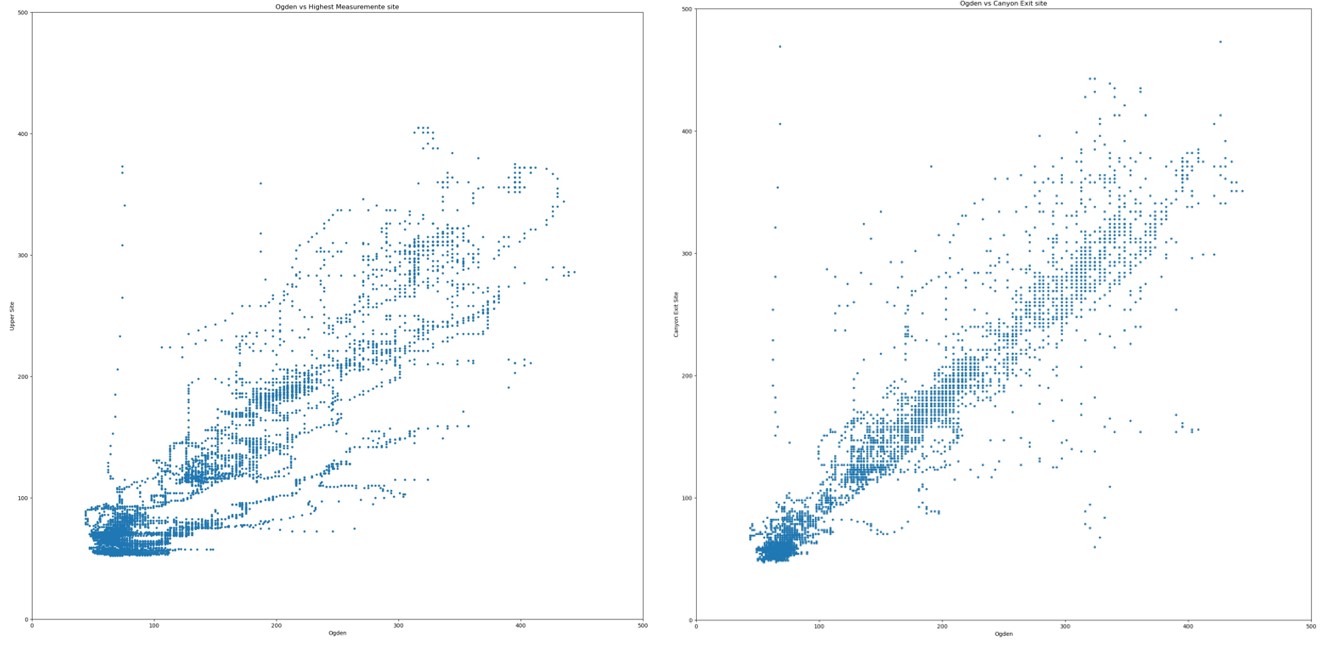
Keeping it simple and showcasing what the groomed data looks like
We can clearly see there is an downstream response to upstream conditions!
But…. lets try to make it even easier to find out how long it takes the river to respond.
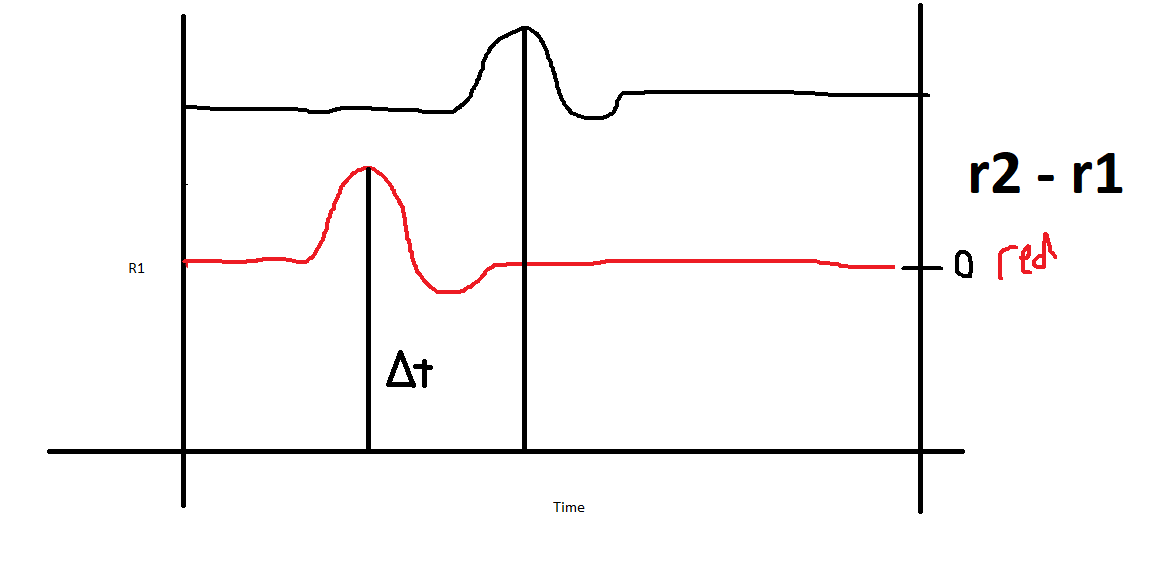
First, lets take the ogden whitewater park CFS, and subtract it from the upmost measurement location r_repsonse = ogdenCFS - UpperMeasurementCFS This will give us the change in simpler ways
We should see something like this terrible paint drawing below
So lets use pandas to open the txt files, then merge them by datetime:
    dfOne["DATETIME"] = pd.to_datetime(dfOne["DATETIME"], utc=True)
    dfTwo["DATETIME"] = pd.to_datetime(dfTwo["DATETIME"],utc=True)
    merged_df = pd.merge_asof(dfOne,dfTwo, on= "DATETIME" , tolerance=pd.Timedelta('1min') )

    merged_df["DIFF"] = merged_df["CFS1"] - merged_df["CFS2"]
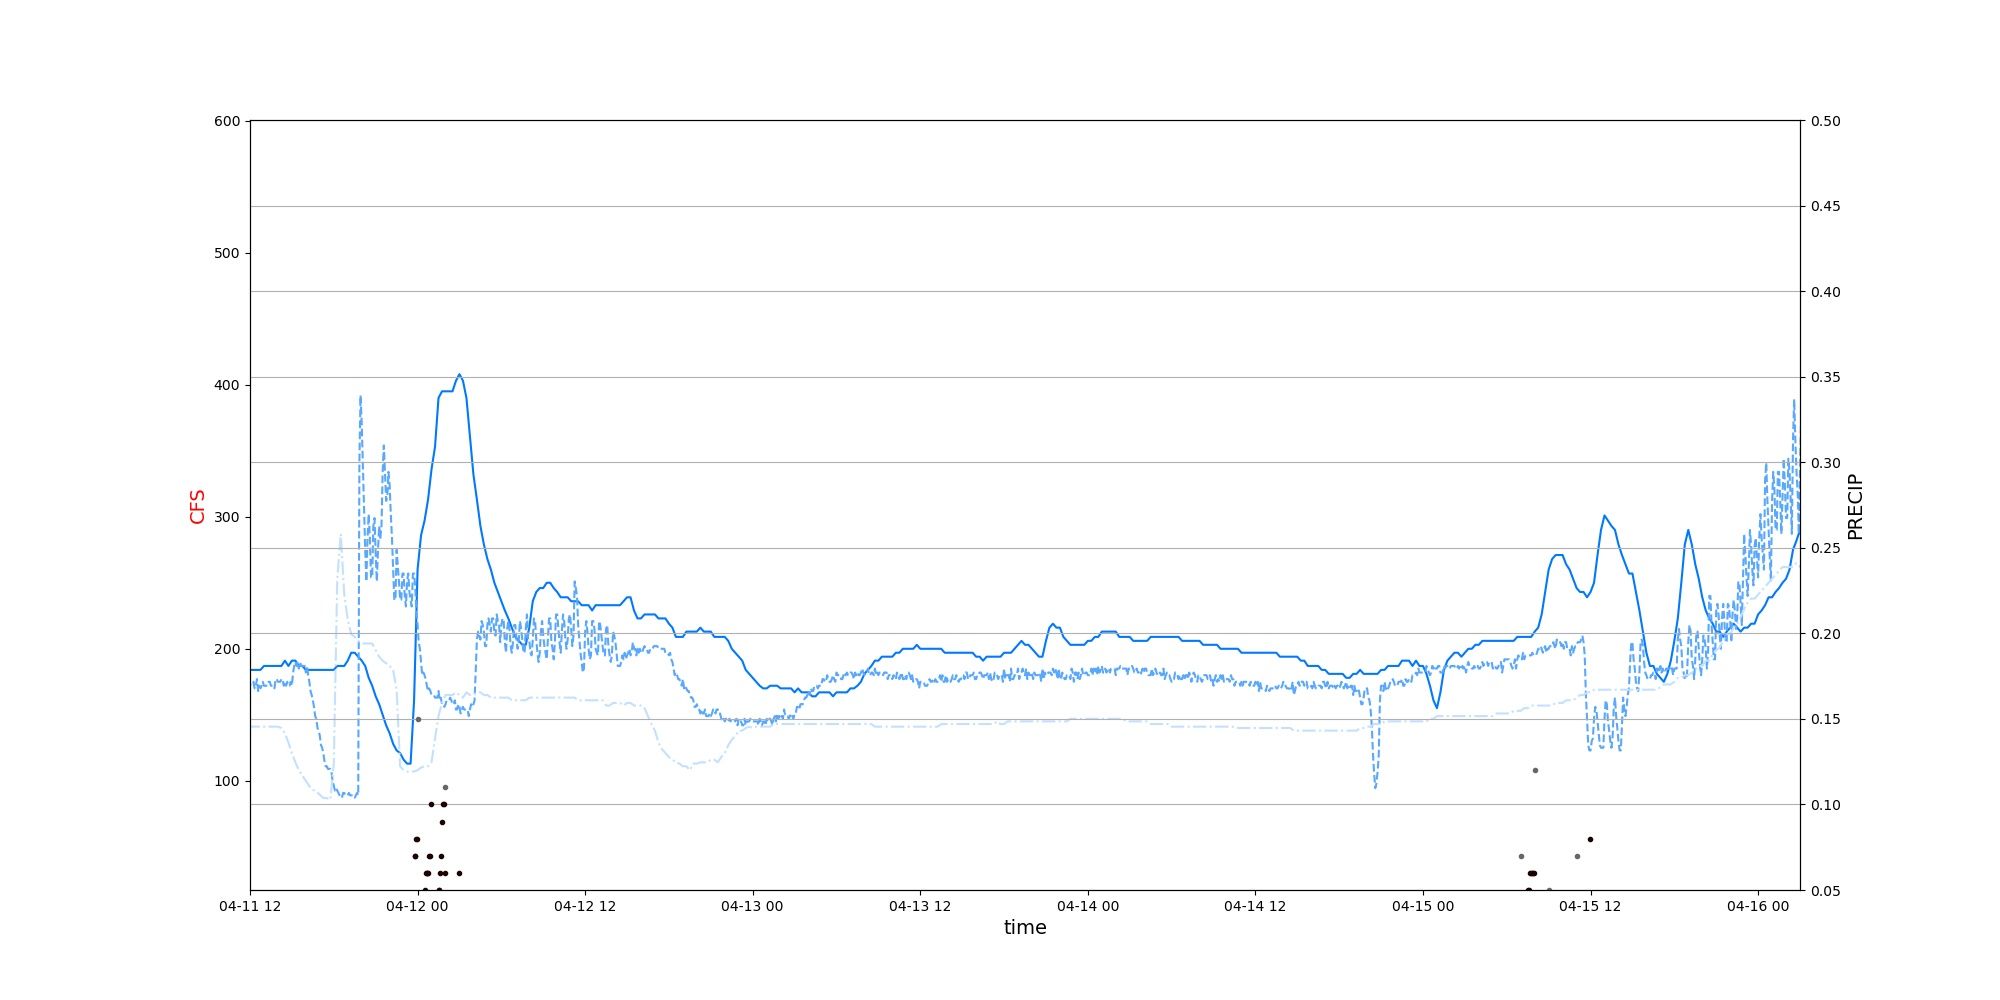
What do we get?
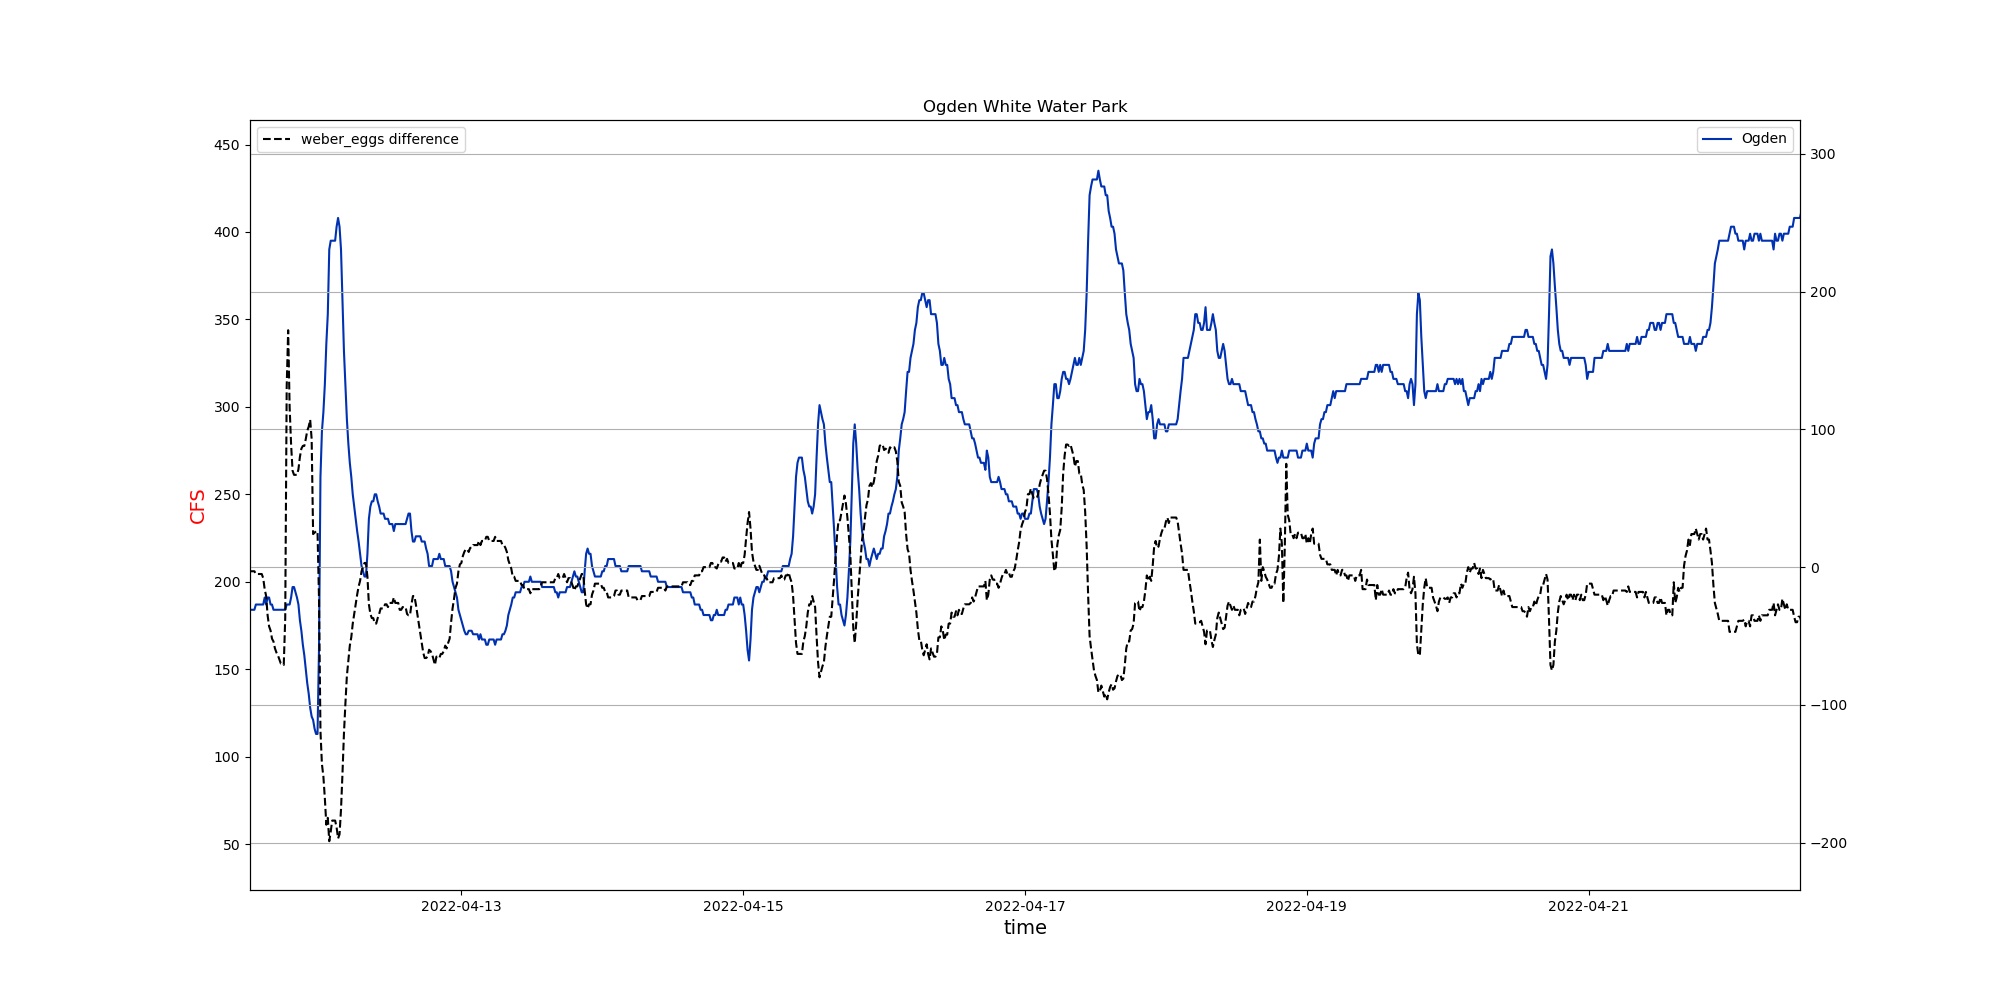 What are we looking at here?
We are looking at three different events/response; precipitation, snow melt, and release. Or a combination of all three.
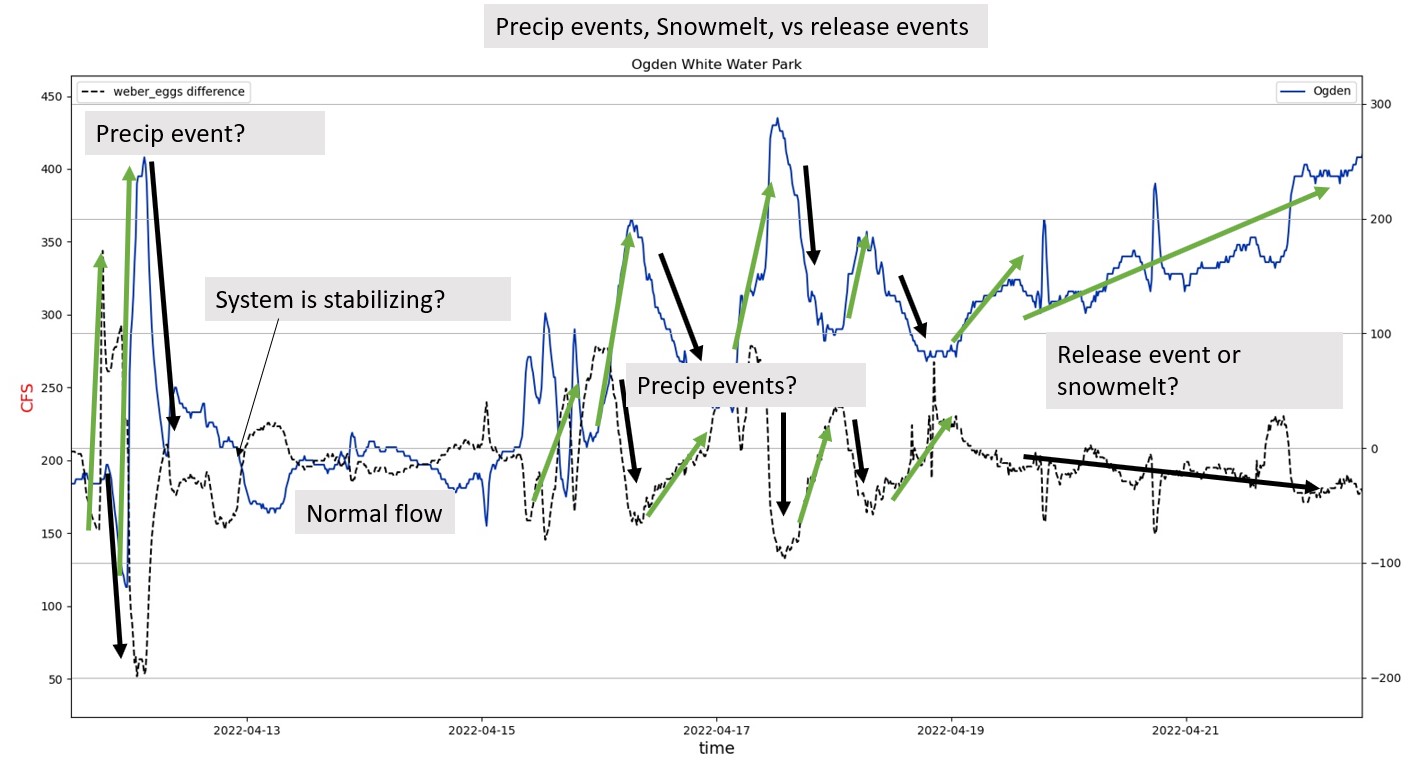
Theories for different events: Precip vs Snowmelt vs Release:
Precipitation event
- Sudden addition of precipitation means we see a rapid shift in differences, hence the large jumps when we subtract ogden from the upper river
- We can see clearly that addition of rain upstream leads to a similiar downstream response a few hours later.
Snowmelt
- Hard to distinguish here, but in theory after snowfall, melting will add water to the system.
Release Event
- This is marked from a planned release of water from dams upstream. The difference are not sudden or quick, and we can see the difference becomes negative meaning that there is additional water added to the system; most likely from a reservoir or river.
In plain english, slow response == release events. Rapid shifts when precip is added to the system.
Testing theories with some basic statistics.